Lots of New Statistics Data in the Quiz Generator
Faculty and TAs ask frequently for more information about the data captured in student exams and quizzes in CoursePlus. Having pre-computed statistics helps them make decisions about what is working (and what is not) in this kind of assessment.
We've added a number of new statistics to the Quiz Generator in CoursePlus. Here's a brief tour:
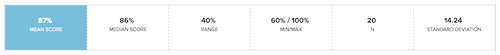
First, basic statistics about student performance on a quiz are now shown on the main "All Responses and Grades" page as soon as students start taking a quiz, and also appear on the main quiz overview page once the quiz is closed to students.
Next, statistics about student performance on each individual question in a quiz are now available. If you view the "Responses to Questions" report on the "Statistics" tab for a quiz, you will see the following information:
- Number of students who answered the question
- Number of students who skipped the question
- Percentage of students who received full credit on the question
- Percentage of students who received partial credit on the question
- Percentage of students who received no credit for the question
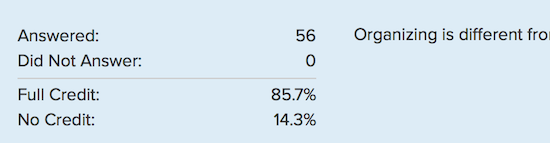
This appears in addition to already existing data on the percentage of students who selected each different possible answer to the question. This data is also shown for essay and fill-in-the-blank questions, fulfilling a long-standing facuty and TA request.
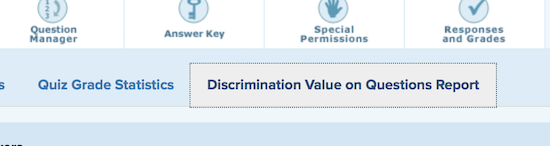
Finally, there's an entirely new tab of statistical data for each quiz: the discrimination value tab:
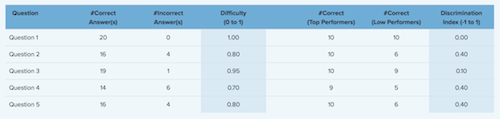
Briefly, this tab shows you information about the difficulty of each question in the quiz. Two pieces of information about each question are shown:
- The difficulty index of the question on a scale of 0-1 as measured by the percentage of students who got full credit for the question.
- The discrimination value for the question. The discrimination value refers to how well an individual question in an assessment differentiates between high and low scorers. The discrimination value can be in the range of -1 to 1. If the majority of students whose overall performance on the quiz was in the top 50% of all scores answered the question correctly, the value will be closer to 1. If the majority of students whose overall performance on the quiz was in the bottom 50% of all scores answered the question correctly, the value will be closer to -1.
In addition to simply showing the difficulty and discrimination values for each question in the quiz, the report also highlights the following:
- The questions answered correctly by the most students
- The questions answered correctly by the fewest number of students
- Questions with a negative discrimination value
- Questions with a discrimination value less than .2, which is generally considered the cutoff for question discrimination desirability.
You can download the source data which splits students into low and high scorers used in calculating the discrimination values in Excel format.
We hope that all this additional data helps you create better quizzes and exams!
If you have any questions about these new features, please contact CTL Help.